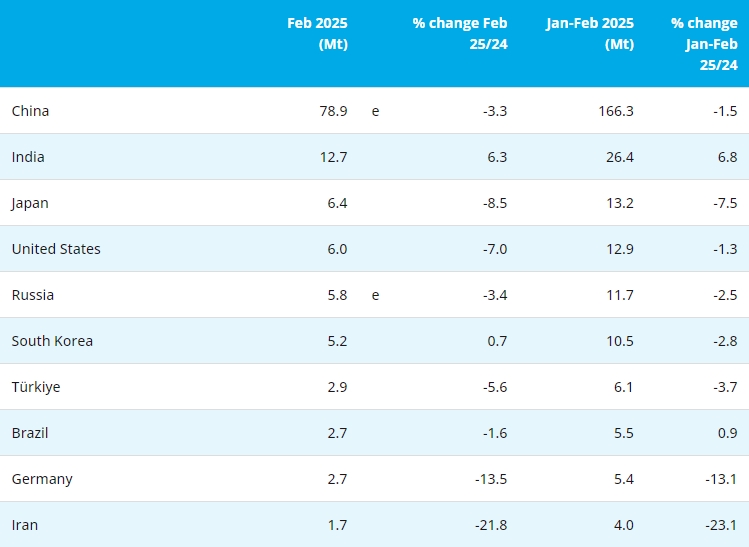
| Import Statistics Data for Ferroalloys Materials and Its Products in July, 2016 Aug. 25, 2016 | ||||||||
| Product | July | Accumulative total by July | Compare with the same month of last year±% | Accumulative Compare with the same month of last year±% | ||||
|
Quantity (ton) |
Amount ($) |
Quantity (ton) |
Amount ($) |
Quantity | Amount | Quantity | Amount | |
| manganese ore | 1,586,845.924 | 200,915,380 | 8,980,175.521 | 957,725,109 | 16.76 | 19.22 | 0.27 | -24.15 |
| chrome ore | 1,023,967.784 | 146,680,049 | 5,669,945.317 | 705,639,263 | -1.87 | -21.06 | -5.21 | -32.89 |
| ferro-alloys | 447,864.028 | 431,864,093 | 2,256,095.131 | 2,255,348,471 | 28.76 | -11.84 | 10.62 | -24.6 |
| FeMn(C>2%) | 5,885.239 | 2,434,205 | 42,235.374 | 20,095,349 | 1023.14 | 962.97 | 209.75 | 172.8 |
| FeMn(C≤2%) | 55.099 | 86,805 | 995.885 | 634,822 | 359.16 | 263.32 | 2057.93 | 410.7 |
| FeSi (Si>55%) | 3,308.901 | 3,051,988 | 17,066.207 | 16,517,219 | 80.98 | 61.87 | 62.5 | 34.15 |
| FeSi (Si≤55%) | 611.073 | 852,424 | 1,694.460 | 2,564,648 | 173.84 | 126.31 | 76.17 | 19.13 |
| MnSi | 7.500 | 8,757 | 10,670.513 | 5,994,306 | 400 | 329.26 | 228537.52 | 5048.73 |
| FeCr(C>4%) | 342,370.751 | 263,832,100 | 1,603,551.258 | 1,149,096,094 | 20.87 | 3.5 | -0.62 | -23.19 |
| FeCr (C≤4%) | 1,726.609 | 2,866,457 | 1,767.409 | 3,170,827 | 5290.6 | 5880.26 | 878.47 | 247.82 |
| SiCr | 0.002 | 4,856 | 1.006 | 10,278 | - | - | -79.49 | -90.52 |
| NiFe | 92,240.123 | 133,956,025 | 557,208.026 | 842,630,339 | 56.03 | -25.95 | 46.8 | -26.84 |
| Ferromolybdenum | - | - | 44.590 | 184,730 | - | - | -72.52 | -92.79 |
| Ferrotungsten | - | - | - | - | - | - | -100 | -100 |
| Ferrotitanium & TiSi | - | - | 0.100 | 544 | - | - | -81.13 | -86.67 |
| Ferrovanadium(V≥75%) | - | - | 22.500 | 291,727 | - | - | 1945.45 | 1066.25 |
| Ferrovanadium(V<75%) | - | - | - | - | -100 | -100 | -100 | -100 |
| Ferroniobium | 1,130.621 | 23,516,176 | 9,349.883 | 202,029,115 | -46.5 | -52.69 | -27.24 | -34.29 |
| RE ferro-alloys | 10.921 | 287,701 | 88.358 | 2,080,825 | -42.34 | -35.64 | 37.46 | 36.07 |
| other ferro-alloys | 502.657 | 377,136 | 11,250.471 | 5,564,503 | -27.93 | -57.07 | 45.82 | 16.72 |
| industrial Silicon | 295.645 | 463,675 | 1,537.511 | 2,942,095 | -4.99 | -32.47 | -7.57 | -35.02 |
| Manganese Electrolytic Metal | 110.402 | 361,789 | 638.712 | 4,591,219 | -71.93 | -69.5 | -29.89 | -1.66 |
| Remark:industrial Silicon and manganese electrolytic metal are excluded in the total import. | ||||||||
| Export Statistics Data for Ferroalloys Materials and Its Products in July, 2016 Aug. 25, 2016 | ||||||||
| Product | July | Accumulative total by July | Compare with the same month of last year±% | Accumulative Compare with the same month of last year±% | ||||
|
Quantity (ton) |
Amount ($) |
Quantity (ton) |
Amount ($) |
Quantity | Amount | Quantity | Amount | |
| manganese ore | 3,405.864 | 911,392 | 18,693.498 | 4,370,532 | 29.08 | 92.02 | 47.6 | 31.95 |
| chrome ore | 300.000 | 66,000 | 1,119.995 | 425,957 | -87.06 | -90.34 | -62.2 | -59.96 |
| ferro-alloys | 27,577.430 | 59,973,272 | 204,536.172 | 399,965,345 | -17.13 | -25.85 | -16.81 | -32.89 |
| FeMn(C>2%) | 151.000 | 138,695 | 1,053.446 | 1,063,394 | 226.84 | 134.08 | -8.78 | -6.09 |
| FeMn(C≤2%) | 5.900 | 8,488 | 222.400 | 378,693 | -95.97 | -97.13 | -85.15 | -85.27 |
| FeSi (Si>55%) | 13,842.739 | 13,774,062 | 110,487.147 | 116,296,893 | -26.83 | -41.67 | -25.18 | -41.34 |
| FeSi (Si≤55%) | 3,079.920 | 3,916,509 | 21,507.120 | 28,007,338 | -15.53 | -28.02 | -5.33 | -21.89 |
| MnSi | 40.000 | 74,319 | 607.880 | 825,275 | -20 | -29.6 | -54.17 | -48.79 |
| FeCr(C>4%) | 144.776 | 218,454 | 1,222.074 | 1,689,175 | 63.5 | 63.31 | -4.1 | -3.57 |
| FeCr (C≤4%) | 1,662.600 | 2,237,133 | 8,556.382 | 14,332,241 | 123.74 | 52.41 | 82.71 | 51.71 |
| SiCr | - | - | 8.000 | 17,200 | - | - | -99.62 | -99.43 |
| NiFe | - | - | 1,023.748 | 3,404,070 | -100 | -100 | -81.21 | -84.49 |
| Ferromolybdenum | 763.000 | 7,819,497 | 1,414.090 | 14,767,822 | 589.56 | 498.39 | 389.63 | 300.26 |
| Ferrotungsten | 141.000 | 2,737,586 | 1,252.000 | 21,969,664 | -46.18 | -53.95 | 35.79 | -10.74 |
| Ferrotitanium & TiSi | 20.700 | 97,472 | 172.600 | 836,336 | 29.38 | 7.79 | 49.91 | 18.16 |
| Ferrovanadium(V≥75%) | 686.000 | 9,064,976 | 3,731.000 | 45,707,193 | 33.2 | -0.86 | -20.99 | -46 |
| Ferrovanadium(V<75%) | 1.000 | 10,800 | 4.900 | 51,356 | - | - | -55.05 | -63.76 |
| Ferroniobium | 20.000 | 377,986 | 209.000 | 4,586,191 | -44.44 | -59.24 | 51.45 | 27.42 |
| RE ferro-alloys | 129.000 | 3,847,497 | 1,124.140 | 35,796,496 | 206.78 | -19.4 | 152.14 | 55.16 |
| other ferro-alloys | 6,507.541 | 6,887,938 | 49,292.526 | 48,409,269 | -18.19 | -38.01 | 4.25 | -20.65 |
| industrial Silicon | 58,195.670 | 114,905,540 | 378,677.428 | 758,352,032 | -21.38 | -31.91 | -15.11 | -28.28 |
| Manganese Electrolytic Metal | 29,247.969 | 45,265,047 | 194,900.742 | 301,051,555 | -6.97 | -17.78 | -7.63 | -27.37 |
| Remark:industrial Silicon and manganese electrolytic metal are excluded in the total export. | ||||||||
Copyright © 2013 Ferro-Alloys.Com. All Rights Reserved. Without permission, any unit and individual shall not copy or reprint!
- [Editor:Juan]


 Save
Save Print
Print Daily News
 Research
 Magazine
 Company Database
 Customized Database
 Conferences
 Advertisement
 Trade
Trade


 Online inquiry
 Contact

Tell Us What You Think