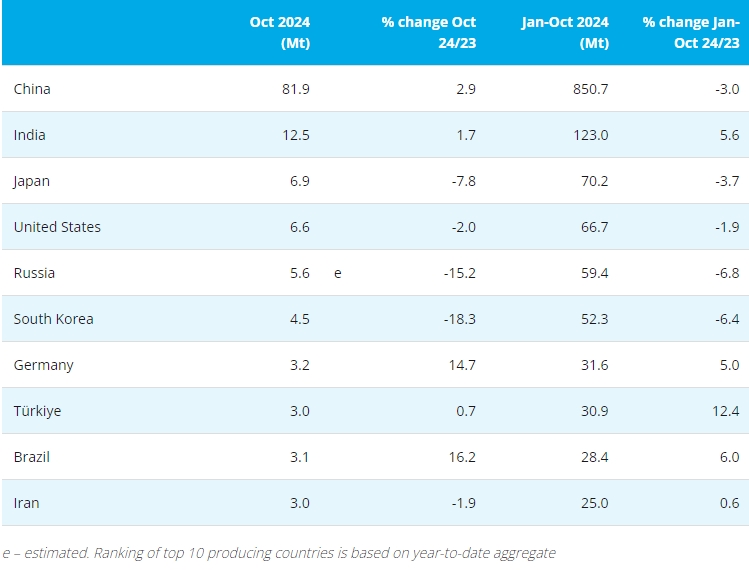
[Ferro-Alloys.com] In May, 2019, Japan imported ferrosilicon(>55%) 33806.692 tons, including 14735.21 tons from China, about 43.59% of the total volume.
In the first months of 2019, Japan imported ferrosilicon(>55%) 187435.183 tons, 37.38% of which was from China, was 70062.639 tons.
| COMMODITY | COUNTRY NAME |
CURRENT MONTH QUANTITY (Ton) |
CURRENT MONTH VALUE (1000YEN) |
CUMULATIVE YEAR TO DATE QUANTITY (Ton) |
CUMULATIVE YEAR TO DATE VALUE (1000YEN) |
| 7202.21-000 | R KOREA | - | - | 160.66 | 20671 |
| 7202.21-000 | TAIWAN | - | - | 206.98 | 28593 |
| 7202.21-000 | INDIA | - | - | 49 | 9199 |
| 7202.21-000 | TURKEY | - | - | 99.39 | 12762 |
| 7202.21-000 | SLOVENI | - | - | 12.037 | 3232 |
| 7202.21-000 | CHINA | 14735.21 | 1950814 | 70062.639 | 9574970 |
| 7202.21-000 | MALYSIA | 6960.67 | 896870 | 32975.576 | 4351585 |
| 7202.21-000 | RUSSIA | 6324.187 | 805807 | 50187.061 | 6687007 |
| 7202.21-000 | BRAZIL | 4239.6 | 987622 | 23186 | 5542696 |
| 7202.21-000 | ICELAND | 1398 | 277221 | 6870.7 | 1425165 |
| 7202.21-000 | NORWAY | 123 | 30751 | 2322.275 | 523172 |
| 7202.21-000 | FRANCE | 20 | 5908 | 1268.84 | 267183 |
| 7202.21-000 | THAILND | 6.025 | 1326 | 34.025 | 7651 |
| TOTAL | 33806.69 | 4956319 | 187435.183 | 28453886 | |
Copyright © 2013 Ferro-Alloys.Com. All Rights Reserved. Without permission, any unit and individual shall not copy or reprint!
- [Editor:kangmingfei]


 Save
Save Print
Print Daily News
 Research
 Magazine
 Company Database
 Customized Database
 Conferences
 Advertisement
 Trade
Trade


Tell Us What You Think