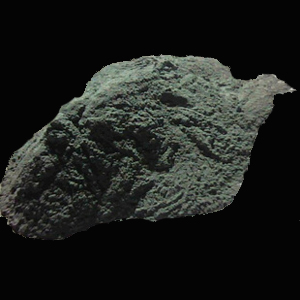
[Ferro-Alloys.com] According to the latest data of Trade Statistics of Japan, in July 2020, Japan imported 21355.046 tons of ferrosilicon (silicon content > 55%), a year-on-year decrease of 48.24% and a month on month decrease of 33.83%. Among them, 9768.95 were imported from Russia, accounting for 45.75%, 5093.3 from Brazil, accounting for 23.85%, and 3700.644 from China, accounting for 17.33%.
| COUNTRY NAME | CURRENT MONTH QUANTITY-TONS | RATIO | CURRENT MONTH VALUE-1000YEN | CUMULATIVE YEAR TO DATE QUANTITY-TONS | RATIO | CUMULATIVE YEAR TO DATE VALUE-1000YEN |
| KUWAIT | - | - | - | 296.85 | 0.141% | 33354 |
| GERMANY | - | - | - | 3.585 | 0.002% | 2210 |
| USA | - | - | - | 0.049 | 0.00002% | 512 |
| RUSSIA | 9768.95 | 45.75% | 1083654 | 69740.93 | 33.173% | 8121682 |
| BRAZIL | 5093.3 | 23.85% | 1027088 | 34995.5 | 16.646% | 7034913 |
| CHINA | 3700.644 | 17.33% | 475635 | 47898.6 | 22.783% | 6003051 |
| MALYSIA | 1570.952 | 7.36% | 164972 | 38052.86 | 18.100% | 4273625 |
| NORWAY | 581.2 | 2.72% | 111543 | 4304.7 | 2.048% | 845456 |
| TAIWAN | 320 | 1.50% | 35438 | 320 | 0.152% | 35438 |
| KAZAKHS | 168 | 0.79% | 18130 | 3669.599 | 1.745% | 375667 |
| ICELAND | 86 | 0.40% | 11981 | 5264.6 | 2.504% | 1020575 |
| VIETNAM | 40 | 0.19% | 4908 | 4137.55 | 1.968% | 503660 |
| THAILND | 20 | 0.09% | 3018 | 91 | 0.043% | 14588 |
| INDIA | 3 | 0.01% | 580 | 34.15 | 0.016% | 6123 |
| FRANCE | 3 | 0.01% | 995 | 1423.84 | 0.677% | 251036 |
| TOTAL | 21355.05 | 100.00% | 2937942 | 210233.8 | 100.000% | 28521890 |
*********************************
Welcome to
The 17th China Ferro-Alloys International Conference
September 23-25 Chongqing, China

Copyright © 2013 Ferro-Alloys.Com. All Rights Reserved. Without permission, any unit and individual shall not copy or reprint!
- [Editor:kangmingfei]


 Save
Save Print
Print Daily News
 Research
 Magazine
 Company Database
 Customized Database
 Conferences
 Advertisement
 Trade
Trade


Tell Us What You Think