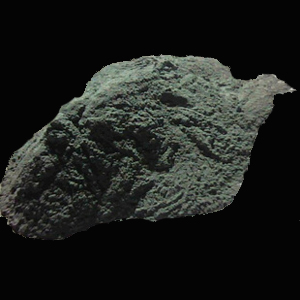
[Ferro-Alloys.com] According to the latest data of Trade Statistics of Japan, in July 2020, Japan imported 718.482 tons of ferrosilicon (≤55%), a year-on-year decrease of 20.895% and a month on month decrease of 68.08%. Among them, 435 tons were imported from China, accounting for 60.54%.
| COUNTRY NAME | CURRENT MONTH QUANTITY-TONS | RATIO | CURRENT MONTH VALUE-1000YEN | CUMULATIVE YEAR TO DATE QUANTITY-TONS | RATIO | CUMULATIVE YEAR TO DATE VALUE-1000YEN |
| USA | - | - | 1.814 | 0.03% | 1167 | |
| S AFRCA | - | - | 100 | 1.43% | 14778 | |
| CHINA | 435 | 60.54% | 66381 | 2967.386 | 42.46% | 500419 |
| NORWAY | 104.235 | 14.51% | 19135 | 894.309 | 12.80% | 164544 |
| SLOVAK | 60 | 8.35% | 6494 | 120 | 1.72% | 13007 |
| RUSSIA | 40 | 5.57% | 4630 | 1973.977 | 28.25% | 206956 |
| R KOREA | 30 | 4.18% | 5768 | 60 | 0.86% | 11752 |
| SLOVENI | 24.247 | 3.37% | 7241 | 50.393 | 0.72% | 14608 |
| THAILND | 20 | 2.78% | 4175 | 800.12 | 11.45% | 165079 |
| FRANCE | 5 | 0.70% | 1784 | 20 | 0.29% | 7921 |
| TOTAL | 718.482 | 100.00% | 115608 | 6987.999 | 100.00% | 1100231 |
*********************************
Welcome to
The 17th China Ferro-Alloys International Conference
September 23-25 Chongqing, China

Copyright © 2013 Ferro-Alloys.Com. All Rights Reserved. Without permission, any unit and individual shall not copy or reprint!
- [Editor:kangmingfei]


 Save
Save Print
Print Daily News
 Research
 Magazine
 Company Database
 Customized Database
 Conferences
 Advertisement
 Trade
Trade


Tell Us What You Think