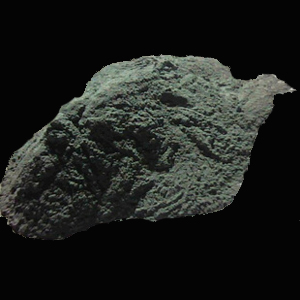
[Ferro-Alloys.com] According to data of China Customs, from January to April 2021, China exported 7878.13 tons of ferrosilicon (containing by weight ≤ 55% of silicon). Among them, 3554.84 tons were exported to Korea, accounting for 45.123%; exports to Japan were 1687.98 tons, accounting for 21.426%.
| Parters | Quantity (tons) | Quantity Proportion | US dollars |
| Korea | 3554.84 | 45.123% | 4,962,927 |
| Japan | 1687.98 | 21.426% | 2,580,879 |
| Malaysia | 621.21 | 7.885% | 898,677 |
| Taiwan, China | 450.6 | 5.720% | 752,167 |
| Thailand | 391 | 4.963% | 627,411 |
| Vietnam | 280 | 3.554% | 411,829 |
| Turkey | 239 | 3.034% | 337,955 |
| Indonesia | 222 | 2.818% | 296,697 |
| India | 120 | 1.523% | 147,578 |
| Pakistan | 109 | 1.384% | 161,390 |
| Russian Federation | 48 | 0.609% | 66,000 |
| Mexico | 36 | 0.457% | 42,480 |
| Columbia | 26 | 0.330% | 36,400 |
| Hong Kong, China | 25 | 0.317% | 35,807 |
| America | 25 | 0.317% | 48,250 |
| Australia | 24 | 0.305% | 42,960 |
| Ukraine | 16 | 0.203% | 24,747 |
| Nigeria | 2.5 | 0.032% | 4,945 |
| Total | 7878.13 | 100.000% | 11479099 |
Copyright © 2013 Ferro-Alloys.Com. All Rights Reserved. Without permission, any unit and individual shall not copy or reprint!
- [Editor:kangmingfei]


 Save
Save Print
Print Daily News
 Research
 Magazine
 Company Database
 Customized Database
 Conferences
 Advertisement
 Trade
Trade


Tell Us What You Think