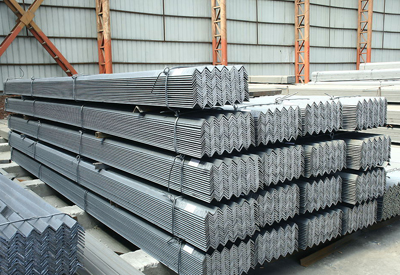
According to data of China Customs, from January to August 2021, China exported 348977.151 tons of ferrosilicon (containing by weight more than 55% of silicon), a year-on-year increase of 81.97%. Among them, 99423.495 tons were exported to Japan, accounting for 28.49%; 82810.176 tons were exported to South Korea, accounting for 23.73%.
| Parters | Quantity (tons) | Quantity Proportion | US dollars |
| Japan | 99423.495 | 28.4900% | 146,168,918 |
| Korea | 82810.176 | 23.7294% | 105,904,182 |
| Indonesia | 56351.309 | 16.1476% | 85,271,025 |
| Taiwan, China | 38235.034 | 10.9563% | 51,274,193 |
| Vietnam | 18514.786 | 5.3054% | 21,764,509 |
| Thailand | 11623.197 | 3.3306% | 16,378,055 |
| Mexico | 7825 | 2.2423% | 11,671,247 |
| India | 6378.5 | 1.8278% | 7,205,544 |
| Chile | 5049 | 1.4468% | 7,035,101 |
| Malaysia | 4784.583 | 1.3710% | 6,917,374 |
| Australia | 2338.711 | 0.6702% | 4,215,611 |
| The People's Republic of Bangladesh | 1707 | 0.4891% | 2,330,005 |
| Pakistan | 1536.06 | 0.4402% | 1,872,847 |
| the Philippines | 1342 | 0.3846% | 1,985,135 |
| Algeria | 1120 | 0.3209% | 1,518,680 |
| Turkey | 1037 | 0.2972% | 1,320,154 |
| New Zealand | 838 | 0.2401% | 1,111,600 |
| U.S.A | 758 | 0.2172% | 1,000,420 |
| Greece | 723.75 | 0.2074% | 900,863 |
| Egypt | 609 | 0.1745% | 872,290 |
| The United Arab Emirates | 585 | 0.1676% | 872,726 |
| Qatar | 496 | 0.1421% | 755,260 |
| Singapore | 491 | 0.1407% | 675,130 |
| Columbia | 464 | 0.1330% | 632,540 |
| Brazil | 446.2 | 0.1279% | 619,660 |
| Saudi Arabia | 380 | 0.1089% | 471,790 |
| Ecuador | 379 | 0.1086% | 579,280 |
| Venezuela | 324 | 0.0928% | 549,180 |
| Myanmar | 300 | 0.0860% | 385,785 |
| Israel | 280 | 0.0802% | 382,000 |
| Morocco | 250 | 0.0716% | 312,415 |
| Bahrain | 238 | 0.0682% | 289,660 |
| Peru | 236 | 0.0676% | 318,021 |
| Oman | 212 | 0.0607% | 294,050 |
| Guatemala | 150 | 0.0430% | 233,000 |
| Ukraine | 145.6 | 0.0417% | 248,097 |
| Mongolia | 122.3 | 0.0350% | 165,705 |
| Britain | 110 | 0.0315% | 128,190 |
| Jordan | 81 | 0.0232% | 112,185 |
| Djibouti | 75 | 0.0215% | 106,125 |
| South Africa | 75 | 0.0215% | 70,501 |
| Nigeria | 62.5 | 0.0179% | 76,274 |
| Russian Federation | 26 | 0.0075% | 29,650 |
| Iran | 24 | 0.0069% | 30,906 |
| Argentina | 10 | 0.0029% | 17,000 |
| Mauritania | 4.95 | 0.0014% | 4,950 |
| Mozambique | 3 | 0.0009% | 2,846 |
| Slovenia | 2 | 0.0006% | 7,825 |
| Total | 348977.151 | 100.0000% | 485,088,504 |
Copyright © 2013 Ferro-Alloys.Com. All Rights Reserved. Without permission, any unit and individual shall not copy or reprint!
- [Editor:kangmingfei]


 Save
Save Print
Print Daily News
 Research
 Magazine
 Company Database
 Customized Database
 Conferences
 Advertisement
 Trade
Trade


 Online inquiry
 Contact

Tell Us What You Think