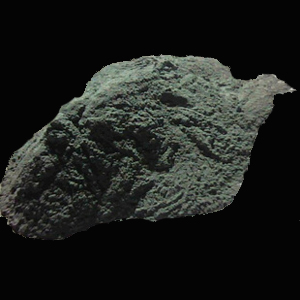
According to data of Trade Statistics of Japan, in October 2021, Japan imported 36512.697 tons of ferrosilicon (containing by weight more than 55% of silicon), a month on month decrease of 2905.7 tons, a decrease of 7.37%; a year-on-year increase of 13691.4 tons, an increase of 59.99%. Among them, 13665.05 tons were imported from Russia, accounting for 37.43%, and 9064.973 tons were imported from China, accounting for 24.83%.
| COUNTRY NAME | CURRENT MONTH QUANTITY (TONS) | CURRENT MONTH VALUE (1000YEN) | CUMULATIVE YEAR TO DATE QUANTITY(TONS) | CUMULATIVE YEAR TO DATE VALUE (1000YEN) |
| TAIWAN, CHINA | - | - | 342.15 | 60629 |
| THAILND | - | - | 503 | 105370 |
| INDIA | - | - | 22 | 4510 |
| KUWAIT | - | - | 1136.447 | 118495 |
| SLOVENI | - | - | 4.535 | 1081 |
| RUSSIA | 13665.05 | 3177499 | 117803.564 | 20441319 |
| CHINA | 9064.973 | 1984047 | 122627.843 | 21692687 |
| MALYSIA | 7044.134 | 1387040 | 37898.257 | 6156162 |
| BRAZIL | 3572 | 857754 | 35147.8 | 7294719 |
| ICELAND | 1191.7 | 245527 | 12108.3 | 2380829 |
| KAZAKHS | 713.932 | 124343 | 9723.336 | 1256470 |
| NORWAY | 490.6 | 110543 | 6520.94 | 1336660 |
| VIETNAM | 419.78 | 129095 | 6320.518 | 1264931 |
| FRANCE | 350 | 74155 | 1630.6 | 314365 |
| GERMANY | 0.528 | 460 | 1.404 | 1299 |
| TOTAL | 36512.697 | 8090463 | 351790.694 | 62429526 |
Copyright © 2013 Ferro-Alloys.Com. All Rights Reserved. Without permission, any unit and individual shall not copy or reprint!
- [Editor:kangmingfei]


 Save
Save Print
Print Daily News
 Research
 Magazine
 Company Database
 Customized Database
 Conferences
 Advertisement
 Trade
Trade


Tell Us What You Think