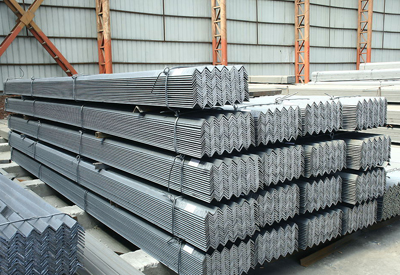
Based on preliminary Census Bureau data, the American Iron and Steel Institute (AISI) reported that the U.S. imported a total of 2,370,000 net tons (NT) of steel in July 2023, including 1,832,000 net tons (NT) of finished steel (down 15.2% and 8.1%, respectively, vs. June 2023). Total and finished steel imports are down 10.7% and 15.5%, respectively, year-to-date vs. 2022. Over the 12-month period August 2022 to July 2023, total and finished steel imports are down 13.7% and 14.0%, respectively, vs. the prior 12-month period. Finished steel import market share was an estimated 21% in July and is estimated at 22% over the first seven months of 2023.
Key steel products with a significant import increase in July compared to June are tin plate (up 26%), mechanical tubing (up 21%), heavy structural shapes (17%) and oil country goods (up 14%). Products with a significant increase in imports over the 12-month period August 2022 to July 2023 compared to the previous 12-month period include line pipe (up 28%), oil country goods (up 24%) and cut lengths plates (up 10%).
In July, the largest suppliers were Canada (531,000 NT, down 16% vs. June), Brazil (384,000 NT, down 8%), Mexico (291,000 NT, down 30%), South Korea (158,000 NT, down 58%) and Japan (122,000 NT, up 50%). Over the 12-month period August 2022 to July 2023, the largest suppliers were Canada (6,909,000 NT, down 1% compared to the previous 12-months), Mexico (4,503,000 NT, down 21%), Brazil (3,222,000 NT, up 3%), South Korea (2,530,000 NT, down 12%) and Japan (1,227,000 NT, down 1%). (AISI)
Copyright © 2013 Ferro-Alloys.Com. All Rights Reserved. Without permission, any unit and individual shall not copy or reprint!
- [Editor:kangmingfei]


 Save
Save Print
Print Daily News
 Research
 Magazine
 Company Database
 Customized Database
 Conferences
 Advertisement
 Trade
Trade


 Online inquiry
 Contact

Tell Us What You Think