

 Save
Save Print
Print[fFerro-Alloys.com] Tshipi Manganese Half-Year FY 25Report and Appendix Results for Announcement to the Market
Tshipi Manganese Mine (continued)
|
|
Unit |
HY2025 |
HY2024 |
HY2023 |
|
Mined volume |
Bcm |
7,905,592 |
6,926,390 |
4,943,347 |
|
Production |
Tonnes |
1,957,057 |
1,801,941 |
1,737,289 |
|
Sales |
Tonnes |
1,721,442 |
1,692,523 |
1,693,616 |
|
Average FOB cost of production |
US$/dmtu |
2.36 |
2.01 |
1.90 |
|
Average CIF price achieved (HGL) |
US$/dmtu |
4.06 |
3.56 |
5.11 |
|
Average FOB price achieved (HGL) |
US$/dmtu |
3.02 |
2.90 |
3.43 |
Note: FOB = Free on Board, CIF = Cost, Insurance Freight, HGL = high-grade lump
Table 1: Summary of operating and financial information for Tshipi
Mining volumes improved compared to the prior comparative period, and ahead of current year plan, with Tshipi focusing on the depletion of the current cut and exposure of ore in the next cut, prior to the usual rainy season across December to February. Tshipi commenced the financial year with strong first quarter production volumes, which then moderated towards the end of the half-year period. Tshipi ceased production of low grade ore in October 2024 due to market conditions. Significant stockpiles remained at the end of December 2024.
Overall logistics volumes were behind plan for the half-year period, owing mainly to the halting of higher cost South African road
transport. Rail volumes were marginally ahead, however were affected by a number of derailments on the ore corridor.
Sales volumes remain on target to meet the business plan on an annualised basis for the financial year, however for the half-year period were behind plan due to the logistics challenges and low grade ore not being sold from October 2024.
Tshipi Financial Summary
A summary of the Statement of Profit or Loss and Other Comprehensive Income and Statement of Financial Position of Tshipi for the half-year periods are presented below on a 100% basis, in its functional currency.
The summary was prepared by Tshipi, and constitutes non-IFRS (International Financial Reporting Standards) information. Non- IFRS information is not subject to audit or review.
The summary is included to provide users of this report a whole view of the financial position of Tshipi, as Jupiter accounts for its investment in Tshipi on an equity accounting basis (refer Note 8 of the Notes to the Consolidated Financial Statements).
|
Statement of Profit or Loss |
HY2025 (ZAR’000) |
HY2024 (ZAR’000) |
|
Revenue |
4,105,486 |
3,369,292 |
|
Cost of sales |
(3,561,447) |
(2,829,455) |
|
Gross profit |
544,039 |
539,837 |
|
Other income |
18,181 |
11,634 |
|
Administrative expenses |
(7,586) |
(7,812) |
|
Impairment of property, plant & equipment/loss on derecognition |
(16,130) |
(525) |
|
Other operating expenses |
(39,801) |
(17,962) |
|
Profit from operating activities |
498,703 |
525,172 |
|
Net finance income |
57,845 |
53,954 |
|
Profit before royalties and taxation |
556,548 |
579,126 |
|
Royalties |
(54,552) |
(34,466) |
|
Profit before taxation |
501,996 |
544,660 |
|
Income tax expense |
(135,790) |
(150,404) |
|
Profit for the period |
366,206 |
394,256 |
|
Jupiter share of profit (49.9%) |
182,737 |
196,734 |
|
Jupiter share of profit ($’000) |
15,429 |
16,138 |
Tshipi Financial Summary (continued)
|
Statement of Financial Position |
HY2025 (ZAR’000) |
HY2024 (ZAR’000) |
|
Cash and cash equivalents |
1,651,303 |
1,152,559 |
|
Trade and other receivables |
658,450 |
718,513 |
|
Other current assets |
1,387,344 |
950,005 |
|
Property, plant & equipment |
4,269,349 |
4,094,133 |
|
Other non-current assets |
214,364 |
214,312 |
|
Total assets |
8,180,810 |
7,129,522 |
|
Trade and other payables |
639,271 |
431,030 |
|
Tax and royalties payable |
99,773 |
- |
|
Other current liabilities |
52,365 |
64,859 |
|
Deferred tax |
1,170,084 |
1,060,516 |
|
Other non-current liabilities |
173,681 |
182,177 |
|
Total liabilities |
2,135,174 |
1,738,582 |
|
Net assets |
6,045,636 |
5,390,940 |
|
Share capital and share premium |
321,359 |
321,359 |
|
Retained earnings |
5,607,316 |
4,952,620 |
|
Contributed assets reserve |
116,961 |
116,961 |
|
Total equity |
6,045,636 |
5,390,940 |
Tshipi Manganese Mine
The Tshipi manganese mine is a long-life, open pit manganese mine with an integrated ore processing plant located in the Kalahari Manganese Field in the Northern Cape Province of South Africa.
For the half-year period ended 31 December 2024, Tshipi recorded a net profit after tax of ZAR366 million ($30.9 million) (HY2024: ZAR394 million; $32.3 million). Tshipi’s net profit was marginally lower than the previous half-year period due to an increase in mining and production volumes and an increase in unit cost of production.
Review Of Operations and Results
During the half-year period, Jupiter’s principal activities were its investment in Tshipi é Ntle Manganese Mining Pty Limited (Tshipi), which operates the Tshipi manganese mine in South Africa, and the marketing of its share of Tshipi manganese ore.
Jupiter released an update to its Company Strategy in January 2025, outlining current market conditions and key industry trends relevant to the company. Developed in March 2023 in response to prevailing market dynamics and opportunities at that time, the strategy continues to provide a strong framework for decision-making. The update reaffirms Jupiter’s guiding principles and strategic direction, with the underlying assumptions remaining valid, reinforcing the Company’s long-term approach.
Jupiter recorded a consolidated result for the half-year of $13,983,749 profit after tax (HY2024 restated: profit of $14,348,406 after tax), including a share of net profit from its investment in Tshipi of $15,429,353 (HY2024: $16,137,466).
Manganese Market
The weekly Fastmarkets manganese ore semi carbonate 36.5% Mn CIF Tianjin price was reported at US$5.67/dmtu on 28 June 2024, and the 36.5% Mn FOB Port Elizabeth price was $4.82/dmtu on the same day. These prices were high when compared to the historical average of the last five years at the time (CIF US$4.43/dmtu; FOB US$3.48/dmtu). Manganese ore prices briefly surged in May 2024, following supply disruptions at South32 Limited’s majority-owned Groote Eylandt mining operation in Northern Territory, Australia, due to Cyclone Megan. Despite this surge, prices had already begun softening before the start of the financial year and continued to decline through Q1 FY25. Prices then stabilised, trading sideways before showing improvement in the latter part of Q2 FY25. The softening in prices was driven by both weakened downstream demand and increased supply. Major manganese ore-producing countries, particularly South Africa, exported higher volumes during Q1 FY25. In China, this led to stock levels at major ports rising from 5.0 million tonnes on 28 June 2024 to 6.0 million tonnes on 27 September 2024, as reported by FerroAlloyNet. A downturn in prices led South African producers to significantly reduce export volumes from October 2024, due to unfavourable market conditions. This reduction helped stock levels at major Chinese ports decrease from 6.0 million tonnes on 27 September 2024 to 5.1 million tonnes by the end of the half-year reporting period. Restocking activities in China in the latter part of the period ahead of Spring Festival in early 2025 further contributed to reducing manganese ore stock levels at Chinese ports. These restocking activities also supported portside manganese ore prices, which generally traded in a similar range to seaborne prices during the period. High-grade manganese ore prices were significantly elevated at the start of the period however similarly declined through the quarter due to weak demand. In response, alloy producers, particularly in China, substituted high-grade ore consumption with alternative material such as manganese-rich slag and sinter.
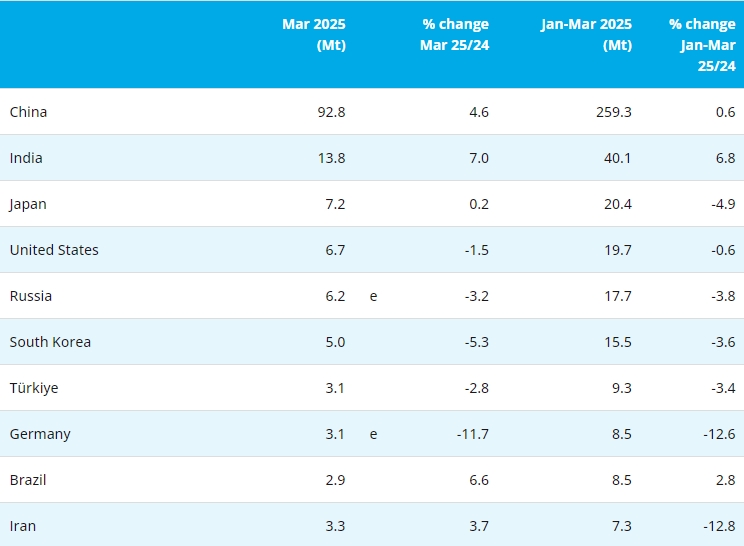
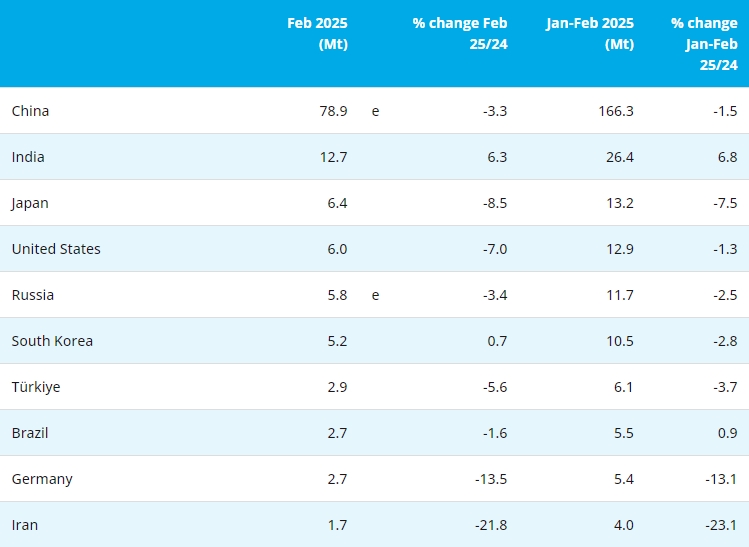
Freight rates similarly declined through the six-month period, particularly in the latter part, as demand for vessels reduced with less exports globally. The weekly Fastmarkets manganese ore semi carbonate 36.5% Mn CIF Tianjin price was reported at US$3.96/dmtu on 27 December 2024, and the 36.5% Mn FOB Port Elizabeth price was US$3.30/dmtu on the same day. The Fastmarkets high grade index CIF Tianjin was US$4.08/dmtu, with a price differential of US$0.12/dmtu being below historical normal levels. Globally, steel demand continues to be weak with crude steel production declining by 1% from the prior comparative period. Prices of some major steel products hit multi-year lows during the period as a result of the dwindling demand. Demand was impacted by continued heightened inflation rates, compared to historical normal levels, geopolitical uncertainties and tighter monetary policies impacting households disposable incomes. In China, crude steel demand continues to be impacted by the struggling residential sector and real estate market. The country has however managed to counteract a portion of the decline in domestic demand with steel exports which witnessed double-digit growth from the prior comparative period. Even though some fiscal and monetary support measures were introduced by the Chinese Central Government, these did not provide broad-based support to steel intensive industries during the period. Crude steel production in India continues to witness strong growth as domestic infrastructure investment continues with production increasing by 6% from the prior comparative period. Growth in crude steel production in many European countries also increased from the prior comparative period. On the contrary, crude steel production was lower in typically major steel producing regions in East Asia due to lower demand from the construction and automobile industries.
- [Editor:tianyawei]
 Daily News
 Research
 Magazine
 Company Database
 Customized Database
 Conferences
 Advertisement
 Trade
Trade


 Online inquiry
 Contact

Tell Us What You Think